The data and code used for this post is in the Tipresias GitHub repo (in the notebooks folder). All data is from AFL matches from 2010 to 2017.
Now that I’ve done some exploratory analysis of AFL data, I’m ready to create the first tipping model for my Campaign for Glory 2019. I’ve already mentioned some of the mistakes that I made in developing Footy Tipper, one of the biggest being reaching for the RNN right away. So, this time I’ll start with linear models for a faster test-and-revise cycle and properly verify whether my previous assumptions are correct or not.
Do classifiers or regressors perform better?
For Footy Tipper, I used an ensemble of classifiers, because that was the goal of the model: classify a team’s result for a given match as a win or loss. The standard footy-tipping tie-breaker of predicting the margin of victory for the first match of every round, however, basically slammed a knee into my back as it jumped over me for the mark, and I was forced to eat the grass of relying on the pre-game line odds as determined by the betting site LadBrokes. It turned out alright, as I had one of the smallest margin errors in the office competition, but, just as I hope to build a model that is more accurate than the betting odds, I hope to build one that is better at predicting victory margins as well. Additionally, during the season, I discovered the bustling AFL statistics community and the excellent site Squiggle, which runs a tipping competition specifically for statistical models and uses mean absolute error, which only applies to regression models, as a secondary performance metric. If I want to play with the big lads and ladies, it seems that a regression model will be necessary. The main objective, however, is still to tip with greater accuracy than any of my coworkers, thus securing insufferable-bragging rights for six months. Achieving a low MAE and the smallest tie-breaker score in the comp aren’t worth much if I’m three tips off the lead. So, the question remains: are classifiers or regressors more likely to make me office footy tipping champion?
To test this, I imported the following models from Scikit-learn:
-
Classifiers: LogisticRegression, RidgeClassifier, DecisionTreeClassifier, LinearSVC, KNeighborsClassifier
-
Regressors: Lasso, ElasticNet, Ridge, LinearSVR
-
I also included RandomForestClassifier and RandomForestRegressor to get one ensemble model comparison.
I didn’t choose these models for any particular reason, I was just trying to get a good spread of the common linear models (plus RandomForest) that are often used in tutorials, blog posts, etc. I included StandardScaler in the pipeline to scale the features, because large differences in numbers impact some models more than others. This also makes the results a little more realistic, because I’m planning on using StandardScaler in the final model pipeline anyway. Since I noticed some issues with over-fitting in my initial tests, I measured model accuracy via 5-fold cross-validation (CV) and for a test set that I held out for performance measurement only.
 Comparison of accuracy scores of basic regression and classification models from Scikit-learn sorted from highest accuracy to lowest
Note: I set the minimum value at 0.6 in order to make the differences among models more visible, because setting the axis at 0 made them all look about the same. It’s just important to keep in mind that Lasso isn’t four times as accurate as DecisionTreeClassifier.
Most of the models actually got a higher accuracy on the test set than the in CV, which isn’t typical and suggests this test set is, just by chance, a little easier to predict (randomising the train/test splits on subsequent trials yields more-typical performance, with CV accuracies being slightly higher than test accuracies). This also suggests that over-fitting the training data isn’t an issue for now. As stated earlier, regressors are better suited to tipping competitions, but if classifiers were significantly better at the core objective — predicting winners — then I’d be willing to focus on that type of model, leaving score prediction as an afterthought. Thankfully, I don’t have to make that compromise, because regressors, making up the top four models tested, clearly outperform classifiers in tipping accuracy. RandomForestRegressor is a notable exception to this, being the only regressor to be less accurate than a classifier, which foreshadows the substandard performance of ensemble models in general that we will see later.
Should data be organised by match or team-match combination?
This is something that I actually tested with my Footy Tipper RNN classifier last year, and I found that splitting home and away teams into separate rows (team-matches) did improve accuracy somewhat. However, in the interest of testing my assumptions, especially given that I’m now dealing with linear regressors instead of neural net classifiers, let’s look at whether this holds up.
For the previous test, I had to use accuracy as the performance metric, because I needed to be able to compare performance between regressors and classifiers, which use different error metrics. However, I recently read a post on the very-informative Matter of Stats that makes a compelling argument for judging models based on an error metric (in this case, mean absolute error) rather than accuracy, because it is more likely to give you the best model. This is due to MAE being more stable than accuracy, which makes the latter more susceptible to dumb luck. In other words, in any given season, the model with the lowest MAE has a better chance of actually being the best model over the long run, than the model with the highest accuracy. Therefore, now that I’m only looking at regressors, I will focus on MAE as the primary metric, though still taking accuracy into consideration, for judging model performance.
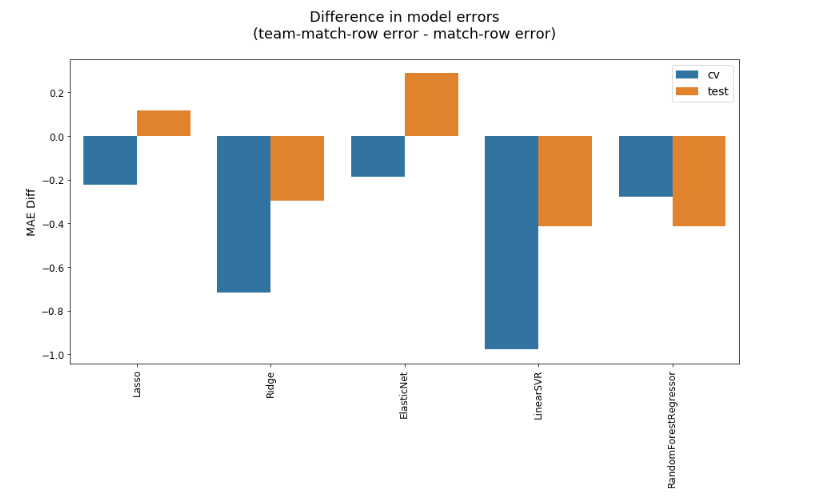 Difference in MAEs of models trained on data with one row per match vs data with two rows (one per participating team) per match, sorted by lowest CV MAE to highest
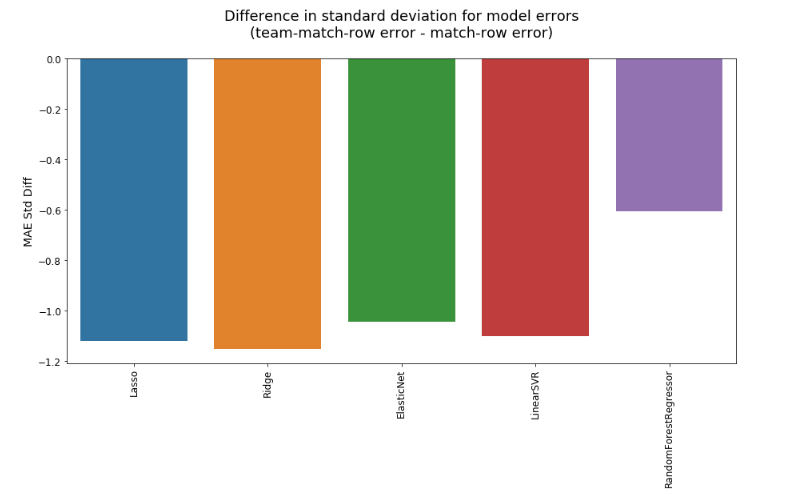
Keeping in mind that, with regards to error, lower is better, reorganising match data into team-match rows (thus doubling the number of rows and nearly halving the number of columns) tends to improve the MAE by a very small amount. There are a couple of exceptions for the test sets, however, which could be due to some randomness or possibly overfitting by the better-performing models. As with the question of regressors vs classifiers, this slightly better performance comes with a configuration that is also a little more convenient. Organising the data by team-match is necessary for calculating various cumulative statistics, and it’s easier if I don’t have to reshape heaps of data just to do some calculations, then reshape them again to fit the match-row structure. Another argument in favor of adopting the team-match-row structure is that, as shown below, it unambiguously lowers the standard deviation of the MAE, meaning that the predictions are, on average, both slightly more accurate and decidedly more consistent.
A closer look at regression models
Now that I’ve decided to use a regression model, and I know the general shape of my data, I’ll add some relevant features based on my previous EDA (home vs away, ladder position, win vs loss streak, etc.) and look at a wider range of potential models, including a number of popular ensembles. In addition to the linear models already examined, I’ll add the following:
-
AdaBoostRegressor
-
BaggingRegressor
-
ExtraTreesRegressor
-
GradientBoostingRegressor
-
SVR (with kernel=’rbf’)
-
XGBRegressor
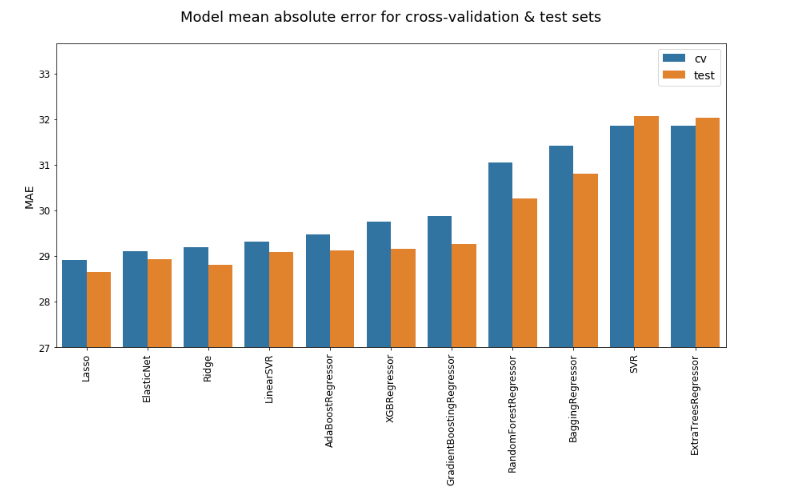 MAEs for each model (Note: the minimum is set to 27 to highlight differences in performance)
As when comparing regressors to classifiers, Lasso, ElasticNet, and Ridge are the best-performing models. Ranking by accuracy or standard deviation shuffles the order slightly. (SVR with rbf kernel has the highest accuracy for some reason), but the same three models are still among the best — and never among the worst — regardless of the metric used. Although ensembles look a little better when focusing on standard deviation (averaging a few different models has a tendency to mitigate extreme results), I was surprised at the extent to which they underperform linear models in both error and accuracy. To see if this was due to overfitting, on account of my larding up the data with too many features, I cut it down to the basics: team, opposing team, line odds (i.e. point spread), year, round number, and home vs away.
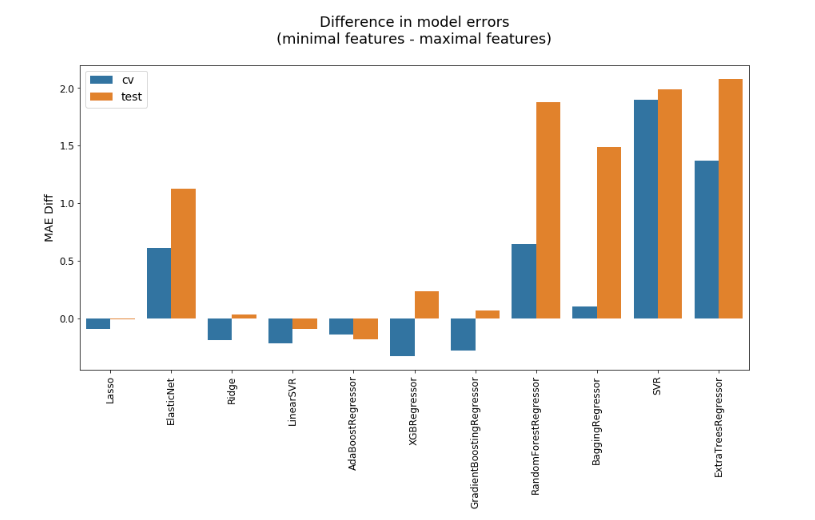
Reducing the number of features has mixed results. With the exception of ElasticNet, it improves MAE by a negligible amount, and it actually hurts the performance of the already-high-MAE ensemble models, which are the models that this change was supposed to help. In the future, I’ll use some regularization and feature consolidation (e.g. ladder position difference instead of ladder position and opposition ladder position as separate features) to keep the dimensionality of the data reasonable, but it looks like the added features provide useful signals to the models.
Which is best, Lasso, ElasticNet, or Ridge?
Since Lasso has the lowest mean absolute error for both cross-validation and test sets, and MAE is my principle performance metric, I’m leaning toward using it for the first version of my footy-tipping model. With Ridge having the best CV accuracy and ElasticNet the best test accuracy, however, any of these models could be considered the best depending on how you weigh the different metrics in your assessment. As the final criteria for determining which model to use, I’ll do cross-validation by season — instead of random split — to see which model performs better, because in a tipping competition it doesn’t matter how much you win by, but whether you win. Destroying the competition one year, only to narrowly lose the next three in a row might give you the same average accuracy as barely winning all four seasons, but the latter wins you a lot more money. And glory. The charts below show model performance per season, with each model being trained on all previous seasons’ data (e.g. to predict match results for 2013, models are trained on data from 2010 through 2012, inclusive).

Technically, Lasso has the lowest MAE in five out of the six seasons, with ElasticNet having the lowest in 2011. Realistically, 2011, 2015, and 2016 are so close that they might as well be ties, meaning Lasso wins outright in 2012, 2013, and 2014, but Lasso and ElasticNet tie in 2011 and 2015, and Lasso and Ridge tie in 2016. Even with this caveat, Lasso still looks like the best model for working with betting data, as its overall lower MAE is consistent enough to make it the winning model for most seasons.
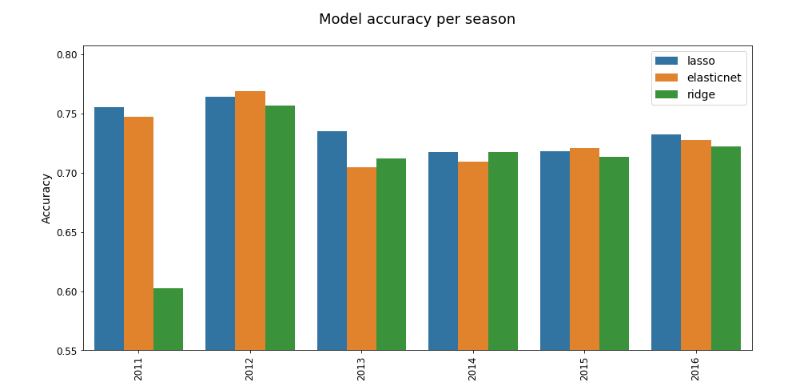
Accuracy continues to be the less-consistent measure of performance, spreading out first place a little more evenly among the top three models. Lasso is the most accurate in 2011, 2013, and 2016; ElasticNet the most accurate in 2012 and 2015; and Ridge ties Lasso in 2014. Even with accuracy’s variability as a performance metric, Lasso proves, yet again, to be the superior model.
Now that I’ve looked at regressors vs classifiers, organising data by match or team-match, and applied multiple metrics and data splits to a wide variety of regression models, I’m confident that the Lasso algorithm is the best choice for the first piece of my burgeoning footy tipping model, which, like one of Hannibal’s elephants, will carry me over the Alps deep into my foes’ homeland and stomp them into the muck that darkens their riversides.