The data and code used for this post is in the Footy Tipper GitHub repo (in the experiments folder). All data is from AFL matches from 2010 to 2017.
I concluded the previous post with a promise to consider AFL match data as a series of events occurring in time, because that is what they are. Though aggregations can reveal patterns across non-temporal dimensions (e.g. home vs away, ladder position, team), they obscure the sport as participants and spectators experience it. In this post I will look at two competing forces in the realm of sports narratives: the long-term perceptions of individual team’s quality (are they good or bad?) and short-term perceptions of a team’s chances of winning their next match (are they hot or cold?).
Betting odds are slow to adjust
In the last post, I looked at oddsmakers’ biases toward different teams, aggregating performance and odds data by team, then by team and year. Teams get better and worse from season to season, however, and even over the course of a single season a team can get off to a hot start only to tumble down the ladder, like hapless Jack down his hill, except with no crown in sight. Perceptions of how good various teams are may be slow to change, but obscuring the passage of time leaves out the fact that they do eventually change: Carlton wasn’t always this bad after all. The question is how quickly does the general public’s perception of a team’s quality, the likelihood of their winning matches, change relative to their real win rate?
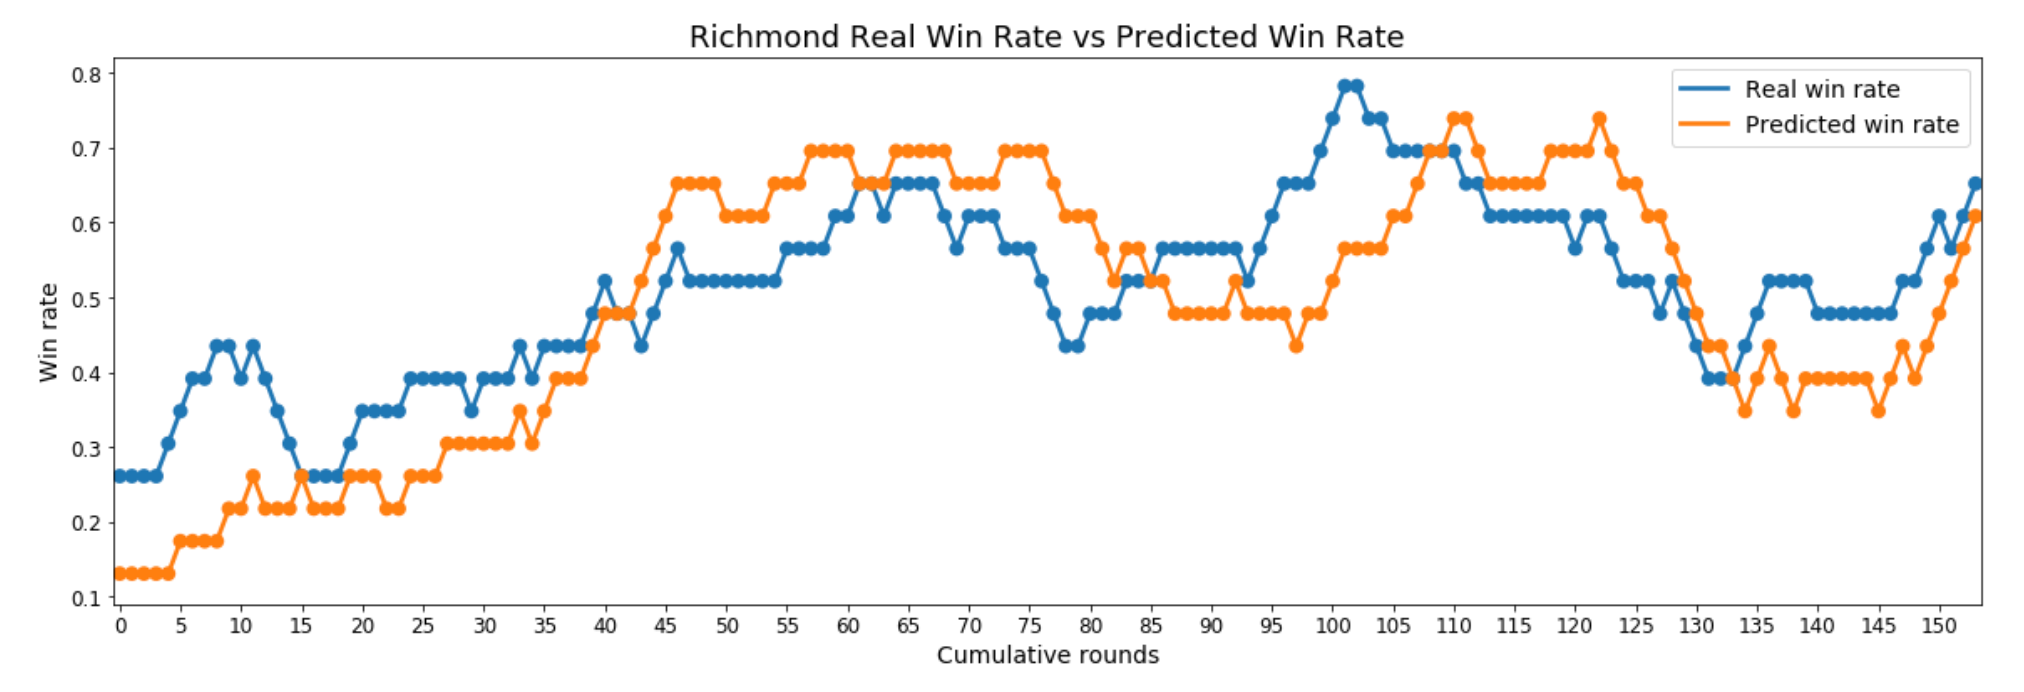
To examine the relevant trends, I plotted each team’s rolling win rate, which averages their winning percentage over the last 23 rounds, updating with each new round, and compared this plot to that of the team’s rolling win rate as predicted by oddsmakers. I chose a 23-round window for the rolling mean for two reasons: being the average season length for the current number of AFL teams, it’s a natural choice, and, perhaps more importantly, it provides a good balance between responsiveness to change and smooth, interpretable charts. Although a holistic, quantifiable summary proved elusive, I did notice three common patterns in the relationship between a team’s real win rate and its predicted win rate.
The Rollercoasters
For teams whose win rate bounces up and down from season to season, their predicted win rate has a tendency to lag their real win rate by 5–15 rounds, finally catching up at peaks and valleys only to continue on its trajectory for a few more rounds, then lagging again while going in the new direction. Good examples of this pattern are Adelaide, Richmond, and Western Bulldogs.
The Winners
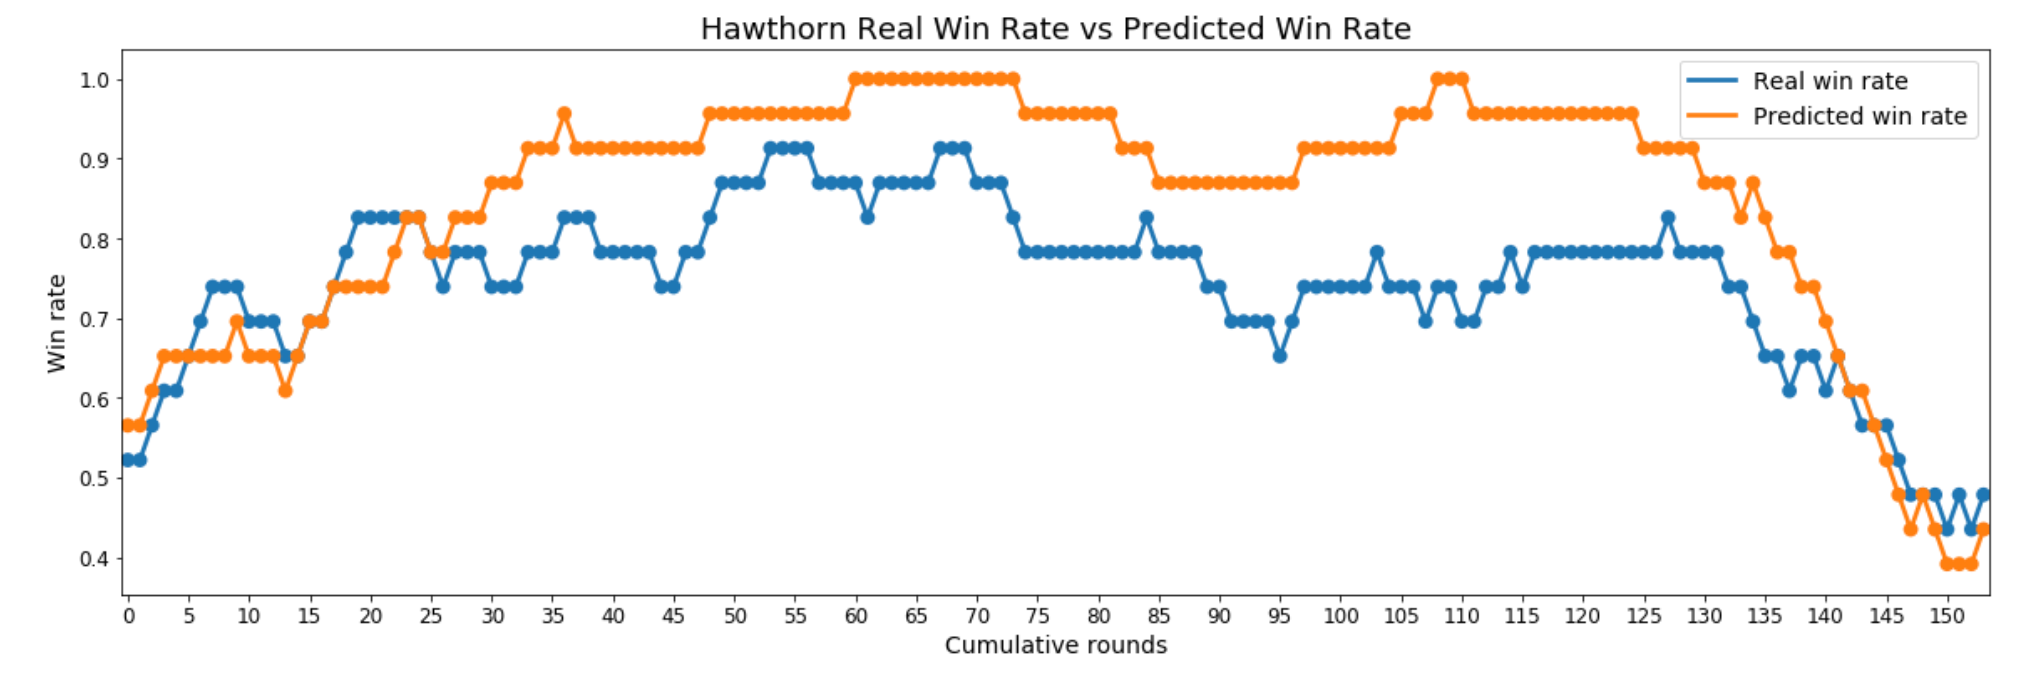
For teams with consistently high win rates that remain flat, or change slowly, over long periods of time, their predicted win rate is generally higher than their real win rate. This is essentially an extended version of the peaks of the rollercoasters. Good examples of this pattern are Hawthorn, Sydney, and Collingwood.
The Losers
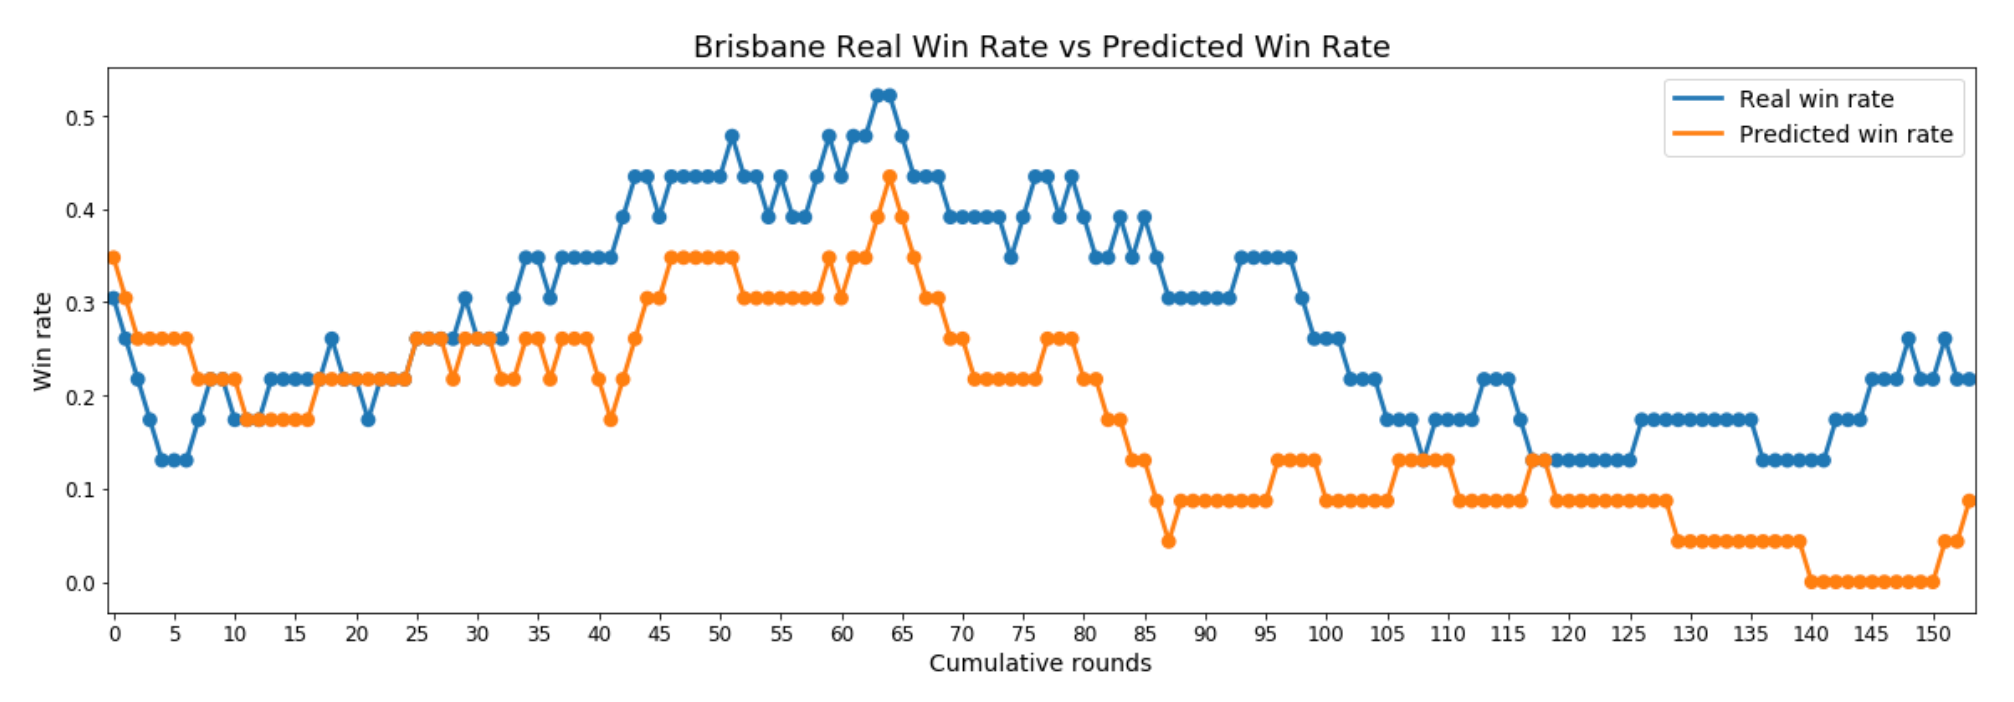
For teams with consistently low win rates that remain flat, or change slowly, over long periods of time, their predicted win rate is generally lower than their real win rate. This is an extended version of the valleys of the rollercoasters. Good examples of this pattern are Brisbane, Melbourne, and GWS (first few years).
Although each pattern has at least a few exemplary teams, it’s important to keep in mind that the rollercoasters are much more common than the winners and losers, mostly because few teams remain consistently good or bad for more than a season or two: constantly changing win rates is the norm in a league with institutional rules designed to promote parity. Given these patterns, a model could potentially estimate the direction (and, to a lesser extent, the size) of the betting odds’ prediction error if it knew the type of team (rollercoaster, winner, or loser), the current average win rate, and the current slope of the win rate plot (are they getting better or worse?). With this in mind, I calculated the slopes of the different win rates and plotted them with the real and predicted win rates, but the resulting charts confused more than they illuminated. However, this will still be worth exploring in the context of developing a machine-learning (ML) model, as an algorithm is often better than I at synthesising whatever signal exists in derived characteristics like the slope of a plot.
Momentum is not a thing
When I created Footy Tipper last year, I researched how people use machine learning for forecasting, with the most-common example being predicting future stock prices based on trends in their past values. There are competing theories as to the relevance of today’s share price to tomorrow’s, but the general conception of time as a sequence of causes and effects, of linear unbroken narratives that tell the story of all existence, is so powerful that people will believe in it regardless of the evidence for or against. With that assumption built into tutorials on ML forecasting, I quickly decided that a recurrent neural network (RNN) should be the basis for my tipping model.
The advantage of an RNN is that, unlike most ML models, it is able to work with three-dimensional data. Typically, data is organised into two-dimensional tables: rows of observations (e.g. people, places, events) and columns of features (characteristics), like an Excel spreadsheet. RNNs, on the other hand, process three-dimensional data, adding a sequence of time periods for a given observation and its features, which allows the model to learn how earlier versions of a given observation influence its current characteristics. In other words, RNNs have a sense of sequential time that simpler ML models lack. As stated earlier, both observers and participants experience AFL matches in a sequence, this trivial fact, along with the equally obvious fact that events do not occur in a vacuum — the past influences the present — made examining actual trends in teams’ win rates seem unnecessary and made RNN the obvious choice for taking historical performance into account.
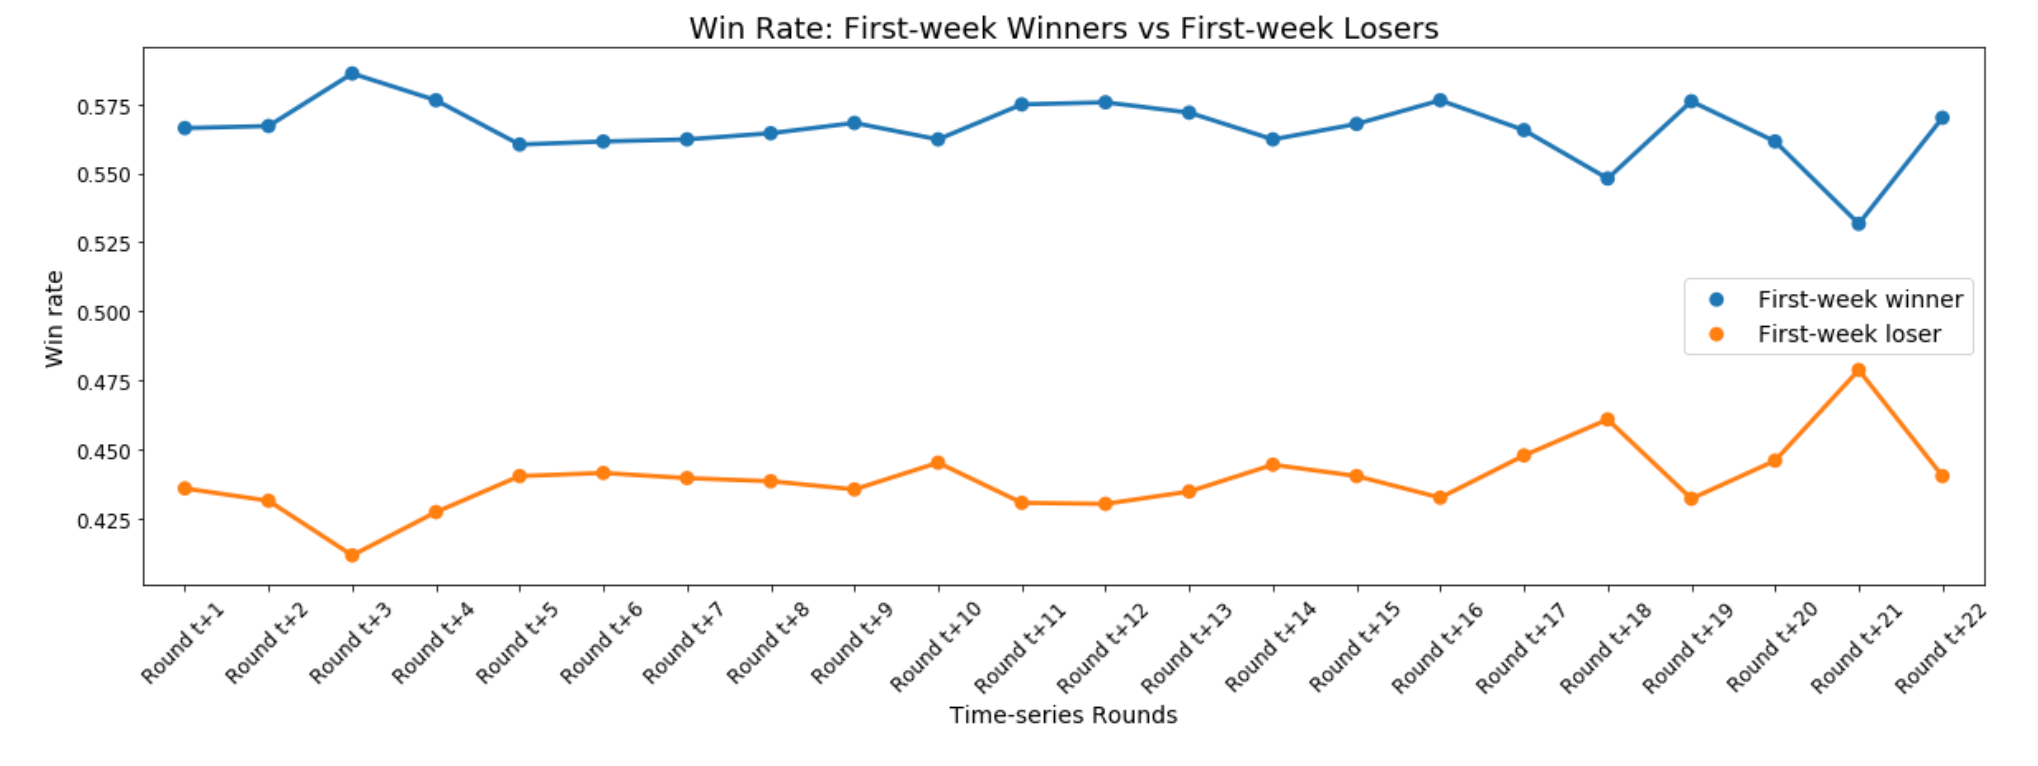
Or maybe not. In Past Craig’s defence, there is a slight bump toward the extremes for winners and losers three weeks after a given round, but win rates quickly regress to their respective means and remain steady for about 10 weeks, sticking close to their overall win rates of 56.6% for winners and 43.9% for losers. What this means is that winning recently is less an indicator of future wins and more an indicator that a given team tends to win in general. In fact, always tipping the winners from a recent round would be a heuristic almost as accurate as always picking the home team (56.6% vs 57.3%).
Teams that regularly win are, of course, more likely to win in any given week, but even consistent losers get lucky and snag a win now and again, which can muddle these single-round win rate trends. What about winning streaks, though? The bottom of the ladder can win a few over the course of a season, but surely they’re not about to win a few in a row on their way to losing the rest through September. So, how predictive of future wins are hot andcold streaks?
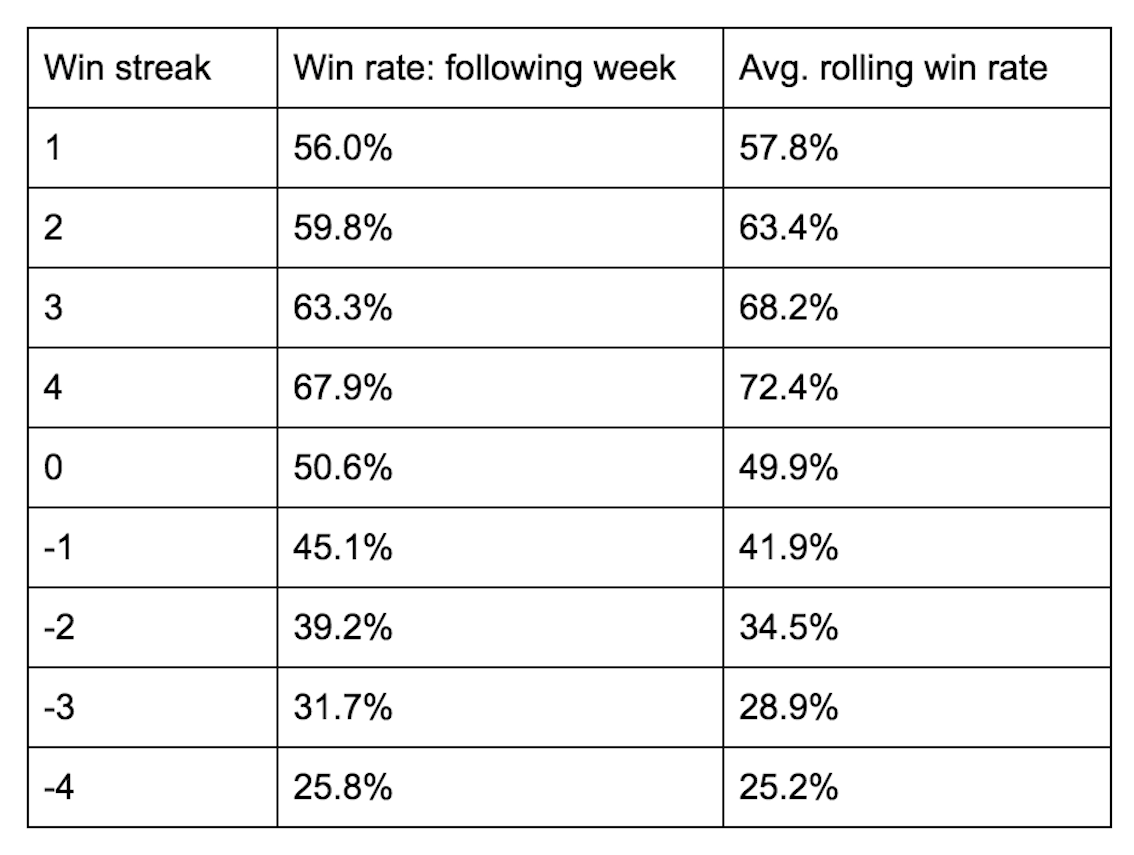 Note: 0 win streak win rate is not 50% due to draws being counted as wins, because in tipping they are
It looks like winning teams are actually less likely to win — and losing teams less likely to lose — follow-up matches than they are to win or lose any given match selected at random. Again, good teams win more often than they lose, whether they’re on a hot streak or not, but they are actually less likely to win the next match after a streak of any length than they are to win in general. Given the prevalence of recency bias, it’s understandable that people have an intuitive sense of hot and cold teams having an above- or below-average win rate, ignoring their even-more-extreme overall win rate, which makes fans over-inflate or over-deflate the expected probability of a future win.
I recently found an example of this when I, anxious about how the upcoming round would affect my performance in the office footy tipping competition, read a preview of the upcoming Melbourne-Sydney match, the first two lines of which are literally as follows:
Melbourne has won four of it’s last five games but dropped three in a row before that. Sydney is back in winning form after losing four of the previous five.
Forgetting for a moment the arbitrary framing of these figures in the pursuit of an easy narrative, if teams’ recent results are at the top of professional commentators’ minds, then such trends are likely to be a preoccupation of the average fan as well. There is further evidence of this in the fact that ESPN’s footytips explicitly displays teams’ last five results (under the heading ‘Streak’) alongside other important information such as ladder position, percentage, and win points. If this recency bias represents the conventional wisdom, and, as I demonstrated in the last post, betting odds tend to amplify conventional wisdom about which teams should win and why, how does this belief affect oddsmakers’ predictions?
The table below gives us an idea of how biased those expectations are by comparing the real win rates to those predicted by betting odds.
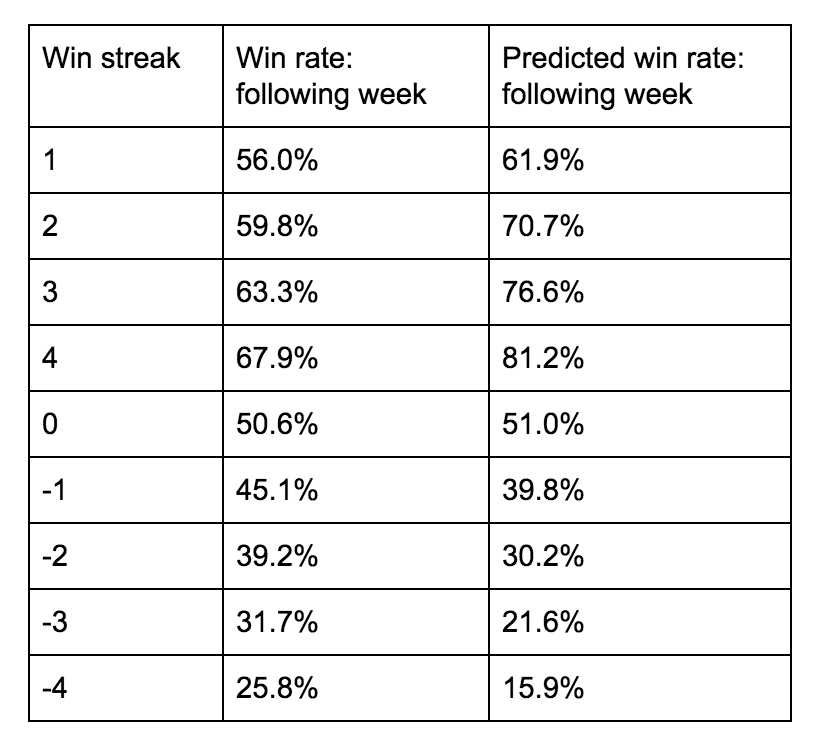 Note: 0 win streak win rate is not 50% due to draws being counted as wins, because in tipping they are
As we saw with other forms of conventional wisdom, the belief that a team that has won or lost recently is just going to keep on winning or losing is contradicted by the data. Betting odds are the chump who buys a stock that’s been rapidly increasing in value for weeks (because of course it’s going to keep going up forever) only to have that same hot stock crash the next day. Past results are not indicative of future returns, my friend. Despite this bias in favour of hot teams and against cold teams, the accuracy of betting odds — in line with earlier analysis — remains pretty consistent across all winning/losing streak lengths (about 70% to 73%, close to the overall accuracy of 72.3%). At this point, however, I’m less interested in finding specific situations in which betting odds are inaccurate, which is never the case when only considering one or two dimensions, but biases that can be exploited by an ML model that can learn under which combination of factors a betting-odds underdog may be more likely to win.
In conclusion
Just as a narrow-minded dedication to basing all knowledge on context-free data analysis can cause one to miss the biases inherent in that data, an obsession with narrative, the stories we tell about our favourite sports and athletes, the drama of it all, can blind us to the statistical reality of long-term trends taking precedence over short-term random walks up and down the boulevard. It’s clear from the above analysis that betting odds, representing the wisdom of the crowd, are particularly susceptible to this way of viewing winning and losing in sports. As bad teams get better and good teams get worse over the rounds and seasons, people still remember when they were bad or good, so fans have difficulty adjusting their perceptions to match the new reality, like parents who continue to buy their children dolls or toy cars well into the latters’ teenage years, because they just can’t believe how fast their little boy or girl is growing up.
Even more difficult than catching up to medium-term changes in teams’ win rates is disinterestedly considering teams’ recent performance and accurately predicting their likelihood of winning next week. It turns out that good teams usually win and bad teams usually lose, and when good teams win too much they are a little less likely, not more, to win again as they keep close to their medium-term win rates.
In starting work on a new, better footy tipping model, I wanted to explore the data more thoroughly in order to gain insight into useful paths of inquiry, as opposed to the spaghetti-against-the-wall approach that I took last time. I believe that I have now done my due diligence in exploring patterns in winning and the biases in betting odds, and am ready to get started on the actual model. And this time, I won’t start with an RNN that takes hours to train.