The data and code used for this post is in the Footy Tipper GitHub repo (in the experiments folder). All data is from AFL matches from 2010 to 2017.
 Photo by Charles Van den Broek on Flickr
Footy tipping is the popular Australian past-time of picking which Australian Rules Football (AFL) teams will win their matches every week (like filling out a March Madness bracket, except it’s done a round at a time, and the umpires make their fingers into pistols when a team scores). Each tipper gets a point for correctly picking the winner and a point in the case of a draw. At the end of the season, the winner is the one with the most points, with predicting the margin of the first match of each round serving as a tie-breaker.
There are a variety of heuristics that one could use to pick the winners and losers for the week. In my conversations with tippers and footy fans, I’ve found that the average participant tends to take in data, such as which team is favoured, which is the home team, how well each team has been playing lately, and whom they expect fellow competitors to tip, then process the input in their gut, arriving in this way at their predictions for the round.
Below, I will present a few basic heuristics for predicting match results, comparing their respective accuracies, following with a deeper analysis of the biases contained in the betting odds for AFL match results.
Comparison of Accuracies of Basic Heuristics
Below is a brief survey of simple, but reasonable, rules for tipping AFL matches. This certainly isn’t a comprehensive list, but for a tipper who isn’t really paying attention to how teams are playing these days, each heuristic represents a means of achieving an accuracy greater than 50% while using a single, easy-to-find data point.
Heuristic 1: Always Tip the Home Team
Although few would pick the home team to win every match, it is a truth universally acknowledged that playing at home is preferable to playing away, so much so that playoff series are structured around the acceptance of this premise, and online tipping competitions punish non-tippers by defaulting to the visiting team.
Accuracy when always tipping the home team: 57.29%
Heuristic 2: Always Tip the Higher-Ranked Team
This, though simple, is probably closer to how a casual fan might tip: the parameters are a quick two-word Google search away (you don’t even have to go to another website), and one is always picking the historically more-successful team from the start of the season to the current round. Of course, upsets do happen, and the difference between #1 and #15 is much greater than it is between #7 and #8.
Accuracy when always tipping the higher-ranked team: 68.00%
Heuristic 3: Always Tip the Odds-on Favourite
From the perspective of the end-user, this is a heuristic almost as simple as tipping the higher-ranked team, but it acts almost like a sophisticated black-box ensemble model: as far as we know, outsiders have access to the same data as oddsmakers, and we know that they’re optimising for revenue, but we don’t know what processes — what secret sauces — produce the line odds and point spreads that people bet on. Maybe a group of cragged, old men in fedoras and cheap suits smoke cigars and argue over exactly how many points Sydney are going to beat St. Kilda by; maybe a distributed deep-learning model, running on GPUs day and night, calculates odds to 100 significant digits every 5 minutes; maybe an augur watches the skies for how the birds are flying on any given day. In any case, the betting odds definitely represent an aggregation of far more data than any of the previous heuristics described.
Accuracy when always tipping the odds-on favourite: 72.32%
Summary of Heuristics
As shown in the average accuracies above, a heuristic’s reliability increases with the number of data inputs that its source takes into account.
-
Calculating the home team just needs one datum: which team is at home.
-
Calculating the higher-ranked team requires somewhat more: both teams’ cumulative wins, draws, scores, and opponents’ scores for the season.
-
Finally, creating the odds for each match potentially takes into account all of the above plus each team’s recent win percentage, their in-game stats, their players’ individual stats, if any players are injured, head-to-head history for each matchup, and so on.
Since tipping the odds-on favourite is the most accurate heuristic by over 4%, I’ll use this as the benchmark against which I’ll measure the performance of the machine-learning model that I will develop later. Therefore, I’ll focus further analysis on examining the biases built into betting odds, with the goal of using this information to help my model identify when to contradict the odds, hopefully achieving greater accuracy as a result.
Analysis of Betting Odds
Now that we know that tipping based on betting odds alone offers the highest accuracy, let’s explore under what conditions betting odds are more, or less, accurate. Odds are determined through a feedback loop of betting companies setting them, bettors risking their money based on perceived inefficiencies (“There’s no way Carlton can lose to Melbourne by over 50!”), then the companies adjusting those odds based on aggregate betting behaviour in order to maximise revenue. This means that betting odds represent a pretty good proxy for footy fans’ conventional wisdom around each team’s win probability, as any discrepancy between oddsmakers and the gambling public gets resolved quickly. So, the question is if there are biases that tend to shape general perceptions of teams’ win probabilities. Under what conditions are upsets more likely? If we can understand when and why the betting odds tend to be less accurate, we can emphasise those features when training a model in the hopes that it will be able to predict match results more accurately.
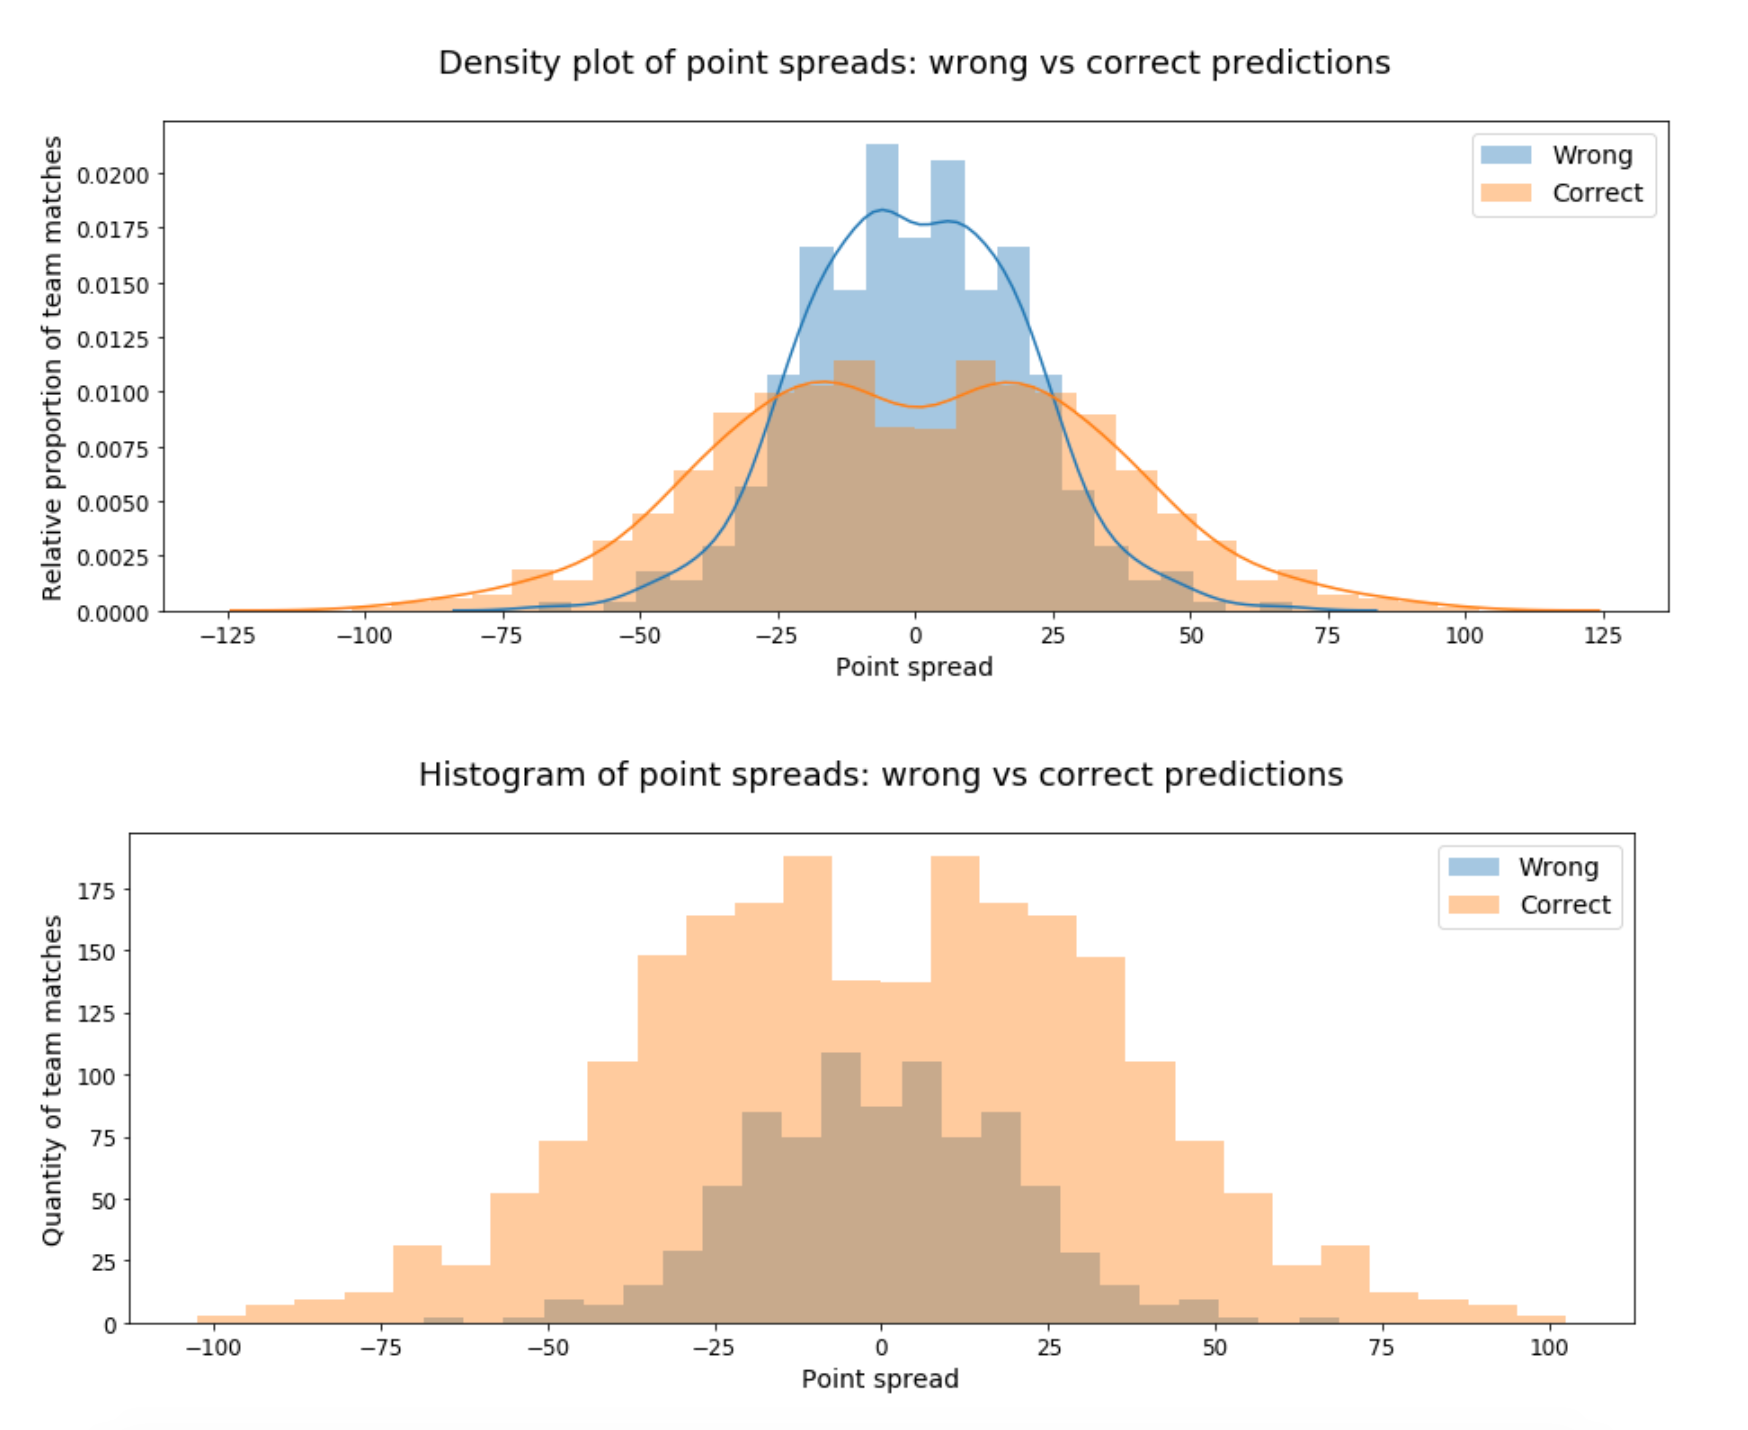
Betting odds are disproportionately wrong when the spread is small (roughly between -25 and 25 points). No surprise there. However, betting odds are correct more often than wrong at every point-spread value, meaning that even for close matches, you’re still better off tipping the favourite.
Betting Odds for Home Teams
As we’ve shown, all other things being equal, home teams win slightly more often (~57%) than visiting teams. So, how do the oddsmakers take this into account? Do they have any biases with regards to home teams vs visiting teams?
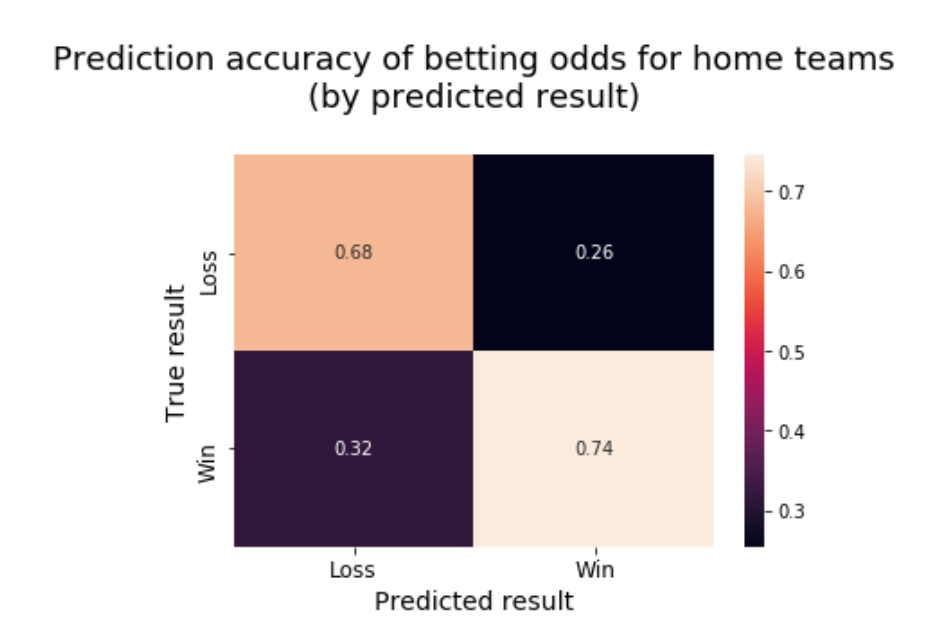
Odds-makers are reasonably balanced in favouring home teams, picking them to win 57.68% of the time, which is in line with home teams’ 57.29% win rate. The oddsmakers improve upon their overall accuracy by about 2% when picking the home team (and do ~4% worse than average when picking away), suggesting that they’re better at recognising when home-field advantage will be a deciding factor than when it won’t.
Betting Odds for Home Teams: Cross-State Matches
Beyond the widely-accepted impact of home-field advantage across sports and leagues, a quirk of the AFL’s origins adds a wrinkle to our analysis. Aussie rules football began as a regional sport in the country’s south and west, with rugby league being the dominant contact sport in the north and east. In fact, the Australian Football League used to be the Victorian Football League, and even now 10 of the league’s 18 teams reside in the state of Victoria, their home stadiums little more than an hour’s drive (1 hour, 1minute according to Google Maps) away from each other. So, the conventional wisdom about home field advantage, based on various conversations that I’ve had, is that it is minor, maybe even nonexistent, for teams from the same area and much more significant when the teams are from different states.
With this in mind, I’ll look at cross-state matches to see if the impact of home field advantage is greater under these circumstances.
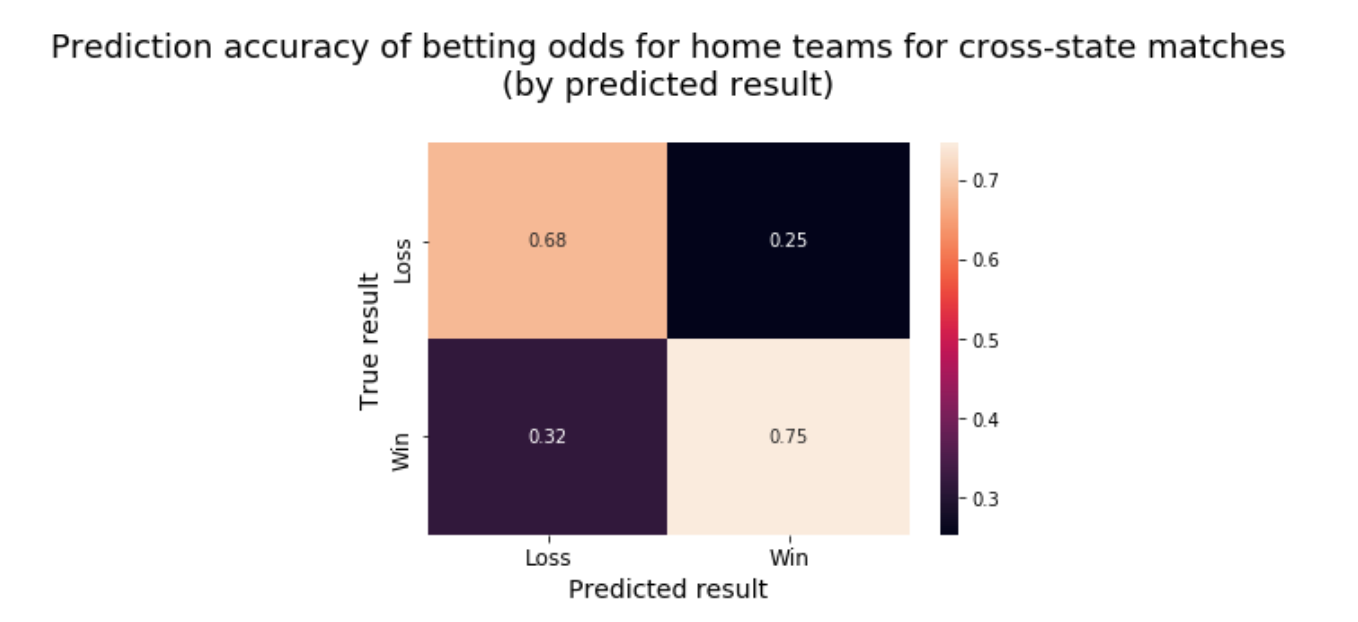
Home teams win 58.16% of cross-state matches, about one point more often than home teams overall, indicating a real, if small, effect from the extra travel distance. The oddsmakers, however, favour cross-state home teams 61.51% of the time, about three points more often, meaning that the conventional wisdom says that the cross-state effect is about three times what it actually is. This is evidence that betting odds tend to amplify conventional wisdom about the factors that contribute to teams’ win probabilities. The accuracy of betting odds for cross-state matches is 72.65%, less than half a point higher than the their overall accuracy. The normalised confusion matrix above also shows similar balance among prediction errors to what we see for all matches.
Betting Odds for Higher-Ranked Teams
As demonstrated earlier, a stronger predictor of win probability than whether a team is playing at home is whether they are higher on the ladder than their opponent (~57% vs ~68%). As such, it makes sense for oddsmakers to generally favour higher-ranked teams. The question is how strong this tendency is and to what extent it is backed up by the actual performance of higher-ranked teams.
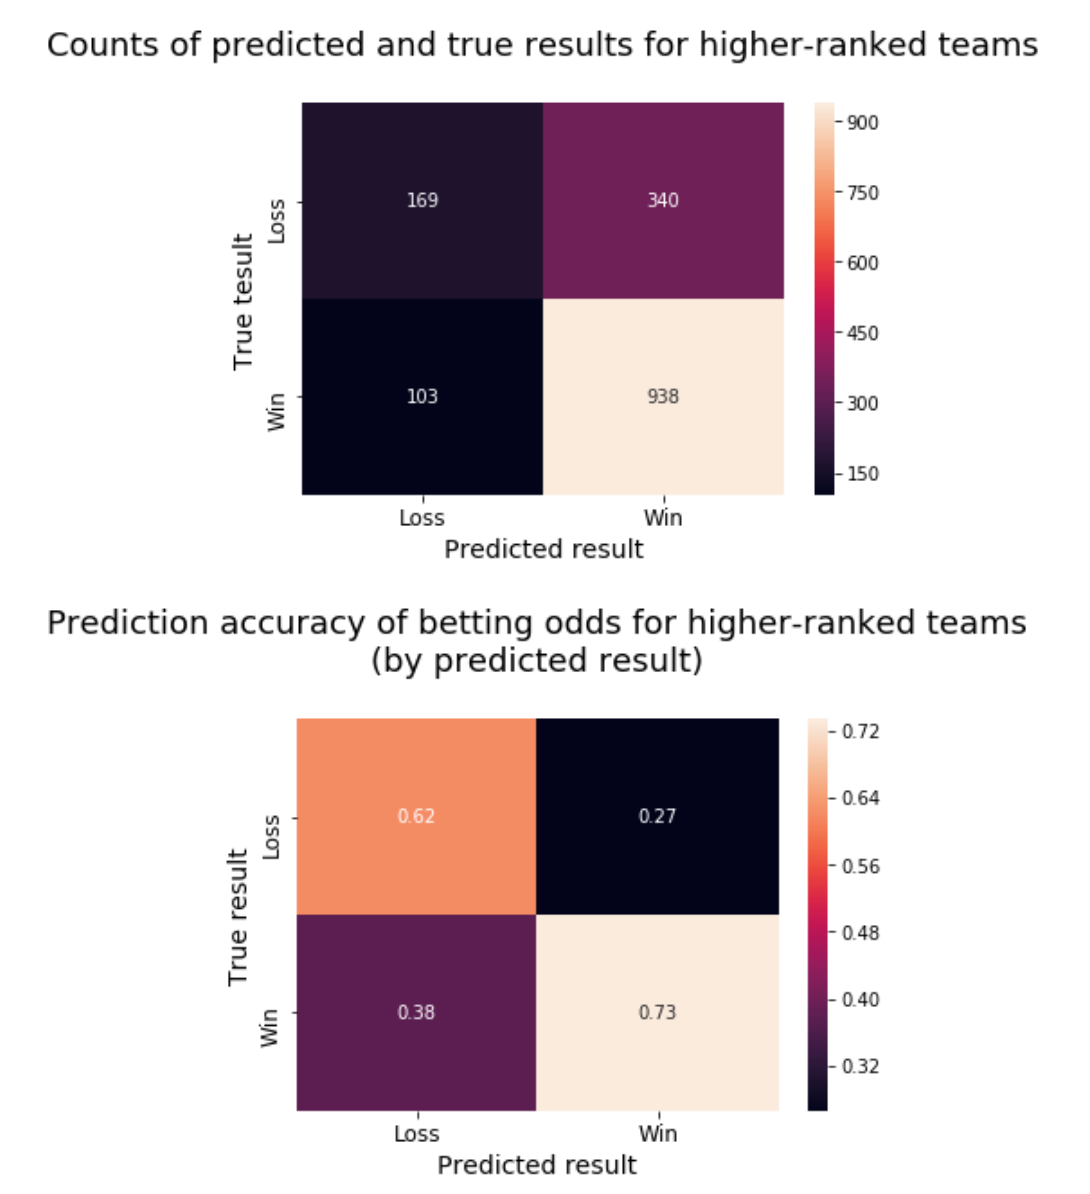
Although higher-ranked teams only win 68.00% of their matches, oddsmakers pick them to win 82.45% of the time, which is a much greater imbalance than we’ve seen with other segments.
Looking at the confusion matrices, we see that betting odds incorrectly favour the higher-ranked team more often than they favour the lower-ranked team at all. Furthermore, as with picking the home team — only more so — oddsmakers are significantly better at identifying when a better team (per their rank) will win than when a worse team will win.
It seems that the stronger the real effect is (home-field advantage, home-field advantage for cross-state matches, ladder rank as a predictor of wins) the more imbalanced betting odds become in favouring the teams that are supposed to win. Even if these biases don’t seem to significantly affect the overall accuracy of betting odds, they do show some situations in which those odds are less accurate, namely when they are contrary to the conventional wisdom. This means that, at least for close matches, when the betting odds favour lower-ranked and/or away teams, it might be worthwhile to occasionally tip their opponents.
Betting Odds by Team
The AFL is closer to American sports leagues than European soccer leagues in how it is organised: There is a draft between seasons in which bad teams get first dibs on the top amateur players, there’s a salary cap, free agency, etc. Many of these rules are meant to promote parity among teams, preventing a situation in which one group of teams are going to the finals, while another group are languishing at the bottom of the ladder, year after year. Despite this, in talking to footy fans, I get the sense that some teams get a reputation for being perennial winners or losers, and that these perceptions are slow to change. This has the potential to influence how oddsmakers treat different teams, basing predictions on reputation more than actual performance.
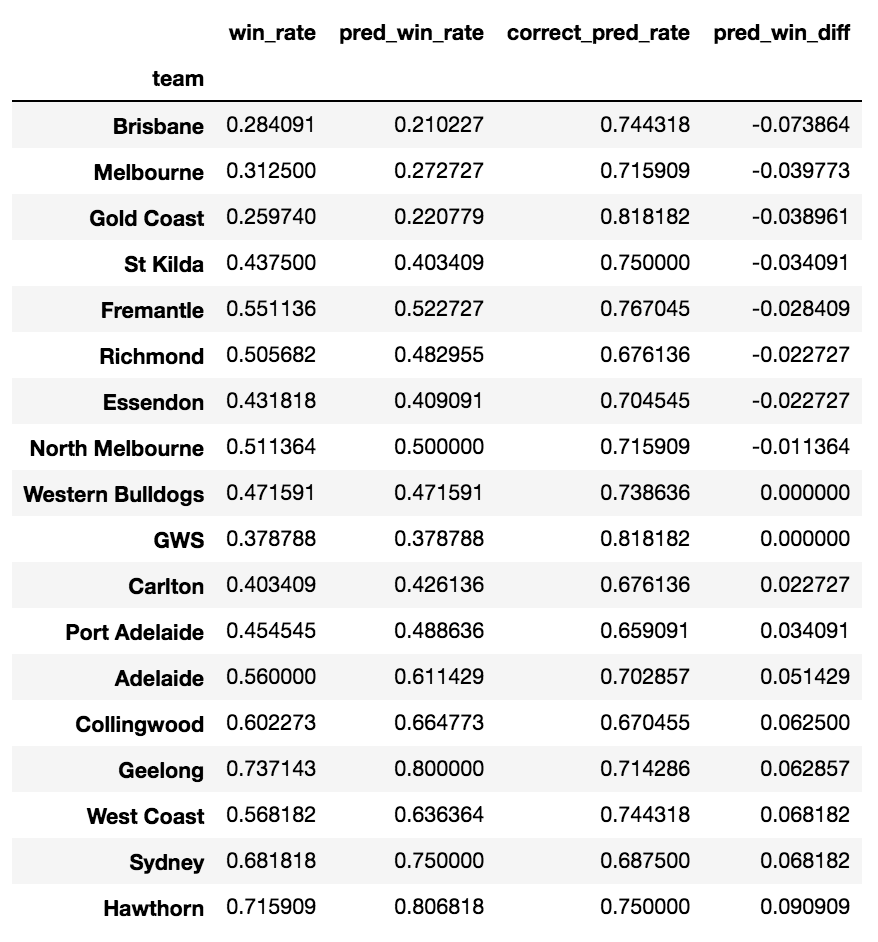 Team win rate vs predicted win rate, sorted by difference between the two (predicted win rate — win rate)
As represented by the percent difference between the win rate and predicted win rate, there does seem to be a tendency to over-favour teams with winning records (Hawthorn, Sydney) and under-favour teams with losing records (Brisbane, Gold Coast).
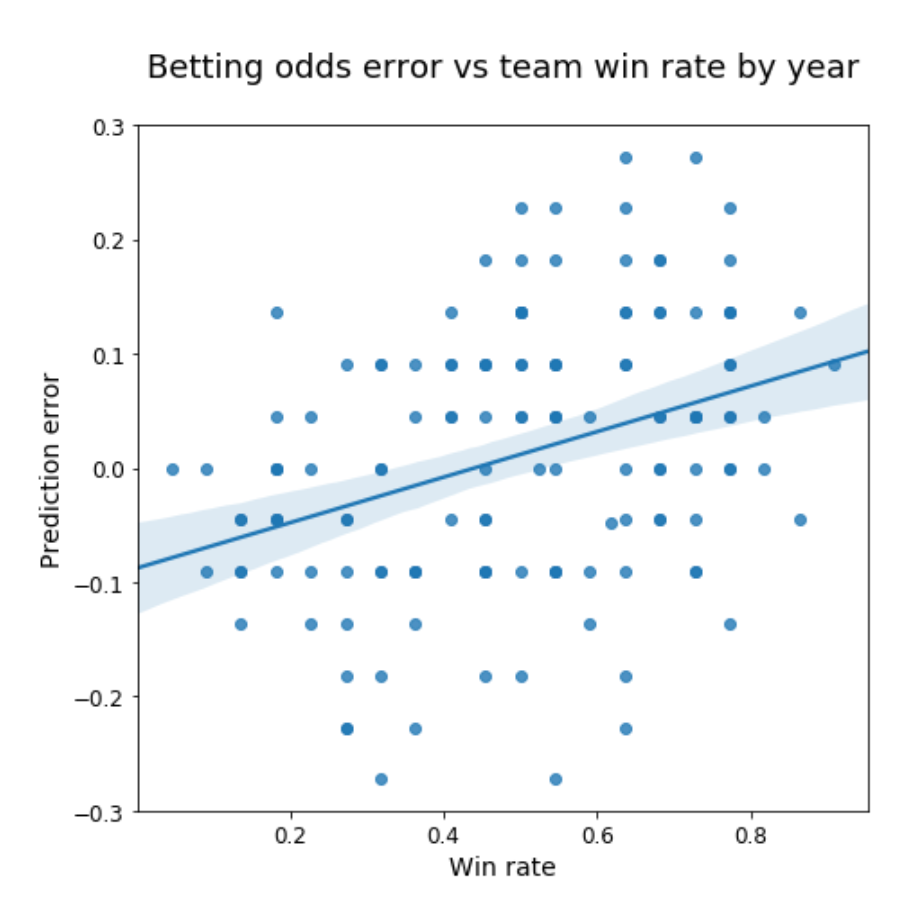
The relationship between teams’ win rates and odds-makers’ tendency to over-favour good teams and under-favour bad teams exists but is weak. Also, the pro-good-team bias, like the other biases examined, doesn’t have much impact on the accuracy of betting odds, as high and low accuracies are spread among teams with varying prediction error values. However, there does seem to be a pattern of good and bad teams being associated with high betting accuracy and mediocre teams being associated with low accuracy.

It is somewhat noisy, but the plot above shows that oddsmakers are somewhat better at predicting results for bad teams and good teams, but have trouble with the mediocre teams that win between 40% and 60% of their matches. This tendency fits with the general pattern of betting odds being less accurate when predicting the outcomes of close matches. Although I can sympathise with the frustration of trying to tip matches with those mid-tier teams that can beat a top team one week and lose to a bottom team the next, this isn’t a terribly interesting observation. Tipping the close matches is the hard part, but those are the ones that you need to get right in order to have a chance at winning the pot.
In Conclusion
Among the simple heuristics explored here, the ones based on a larger number of data inputs tend to be better at predicting AFL match results, with betting odds being the most accurate predictor of all. Breaking down matches by different dimensions demonstrated some biases and weaknesses in oddsmakers’ ability to predict winners and losers. Betting odds tend to amplify the conventional wisdom about the factors that contribute to victory, favouring teams that benefit from those factors at a higher rate than their win rate warrants. However, these biases have little impact on betting odds’ performance, with lower accuracy generally centred around close matches, which are difficult to predict regardless of the quality and sophistication of one’s methods. The one slight weakness that a model could exploit is that betting odds’ accuracy suffers when they defy conventional wisdom by favouring lower-ranked and/or away teams.
One important dimension that I haven’t covered is that of time. AFL match data can be aggregated by team or home vs away or higher- vs lower-ranked, but they represent discrete events that occur in a sequence, and past matches not only affect future matches, but trends in teams’ performance on the field impact the conventional wisdom about who will win next week, which in turn affects the betting odds for next week’s matches. Time is a large subject, however, so I will dig into it in the next post.